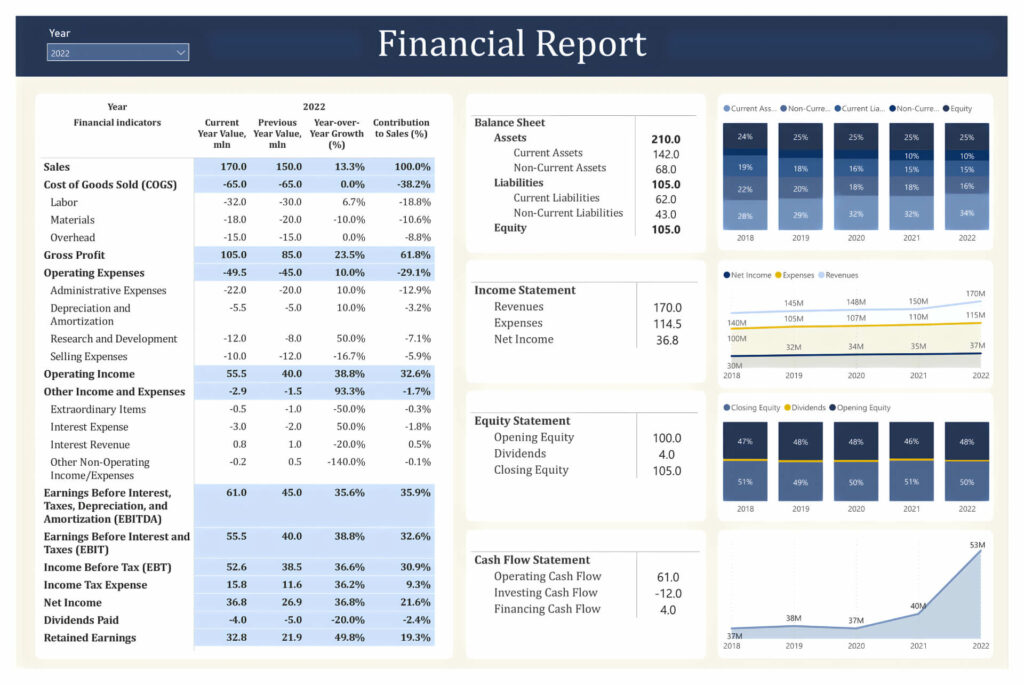
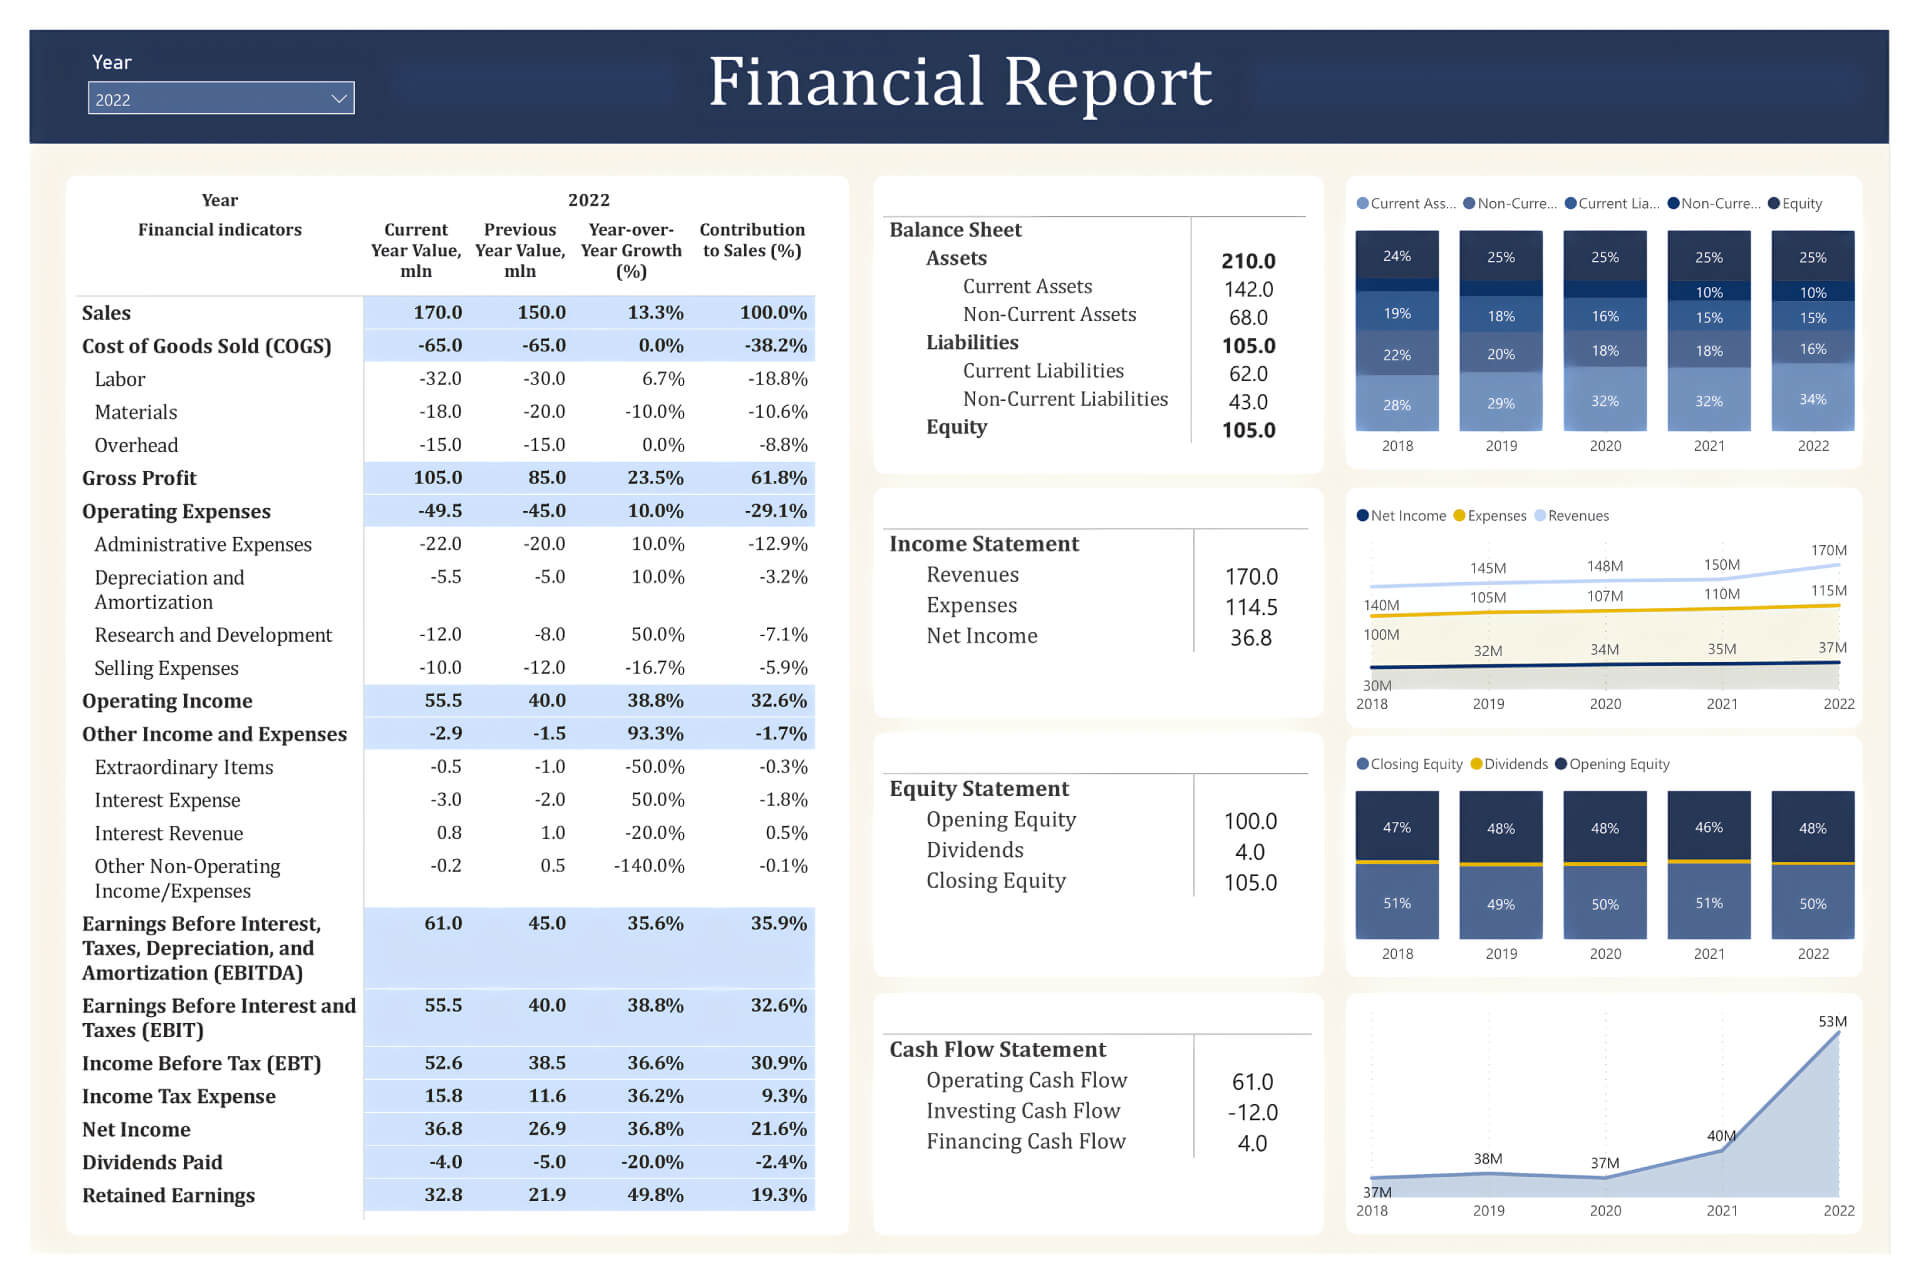
Salini Company, a well-established manufacturing firm, has been facing challenges in efficiently managing and analyzing its financial data. The existing financial reporting tools are outdated, leading to a lack of timely insights and decision- making capabilities.
Development of a Custom Interactive Financial Dashboard using Microsoft Power BI:
Core Functionality: Our solution is a custom-built dashboard in Power BI, designed to integrate real-time financial data from Salini Company’s various sources.
Interactive Features: The dashboard will offer interactive elements such as clickable charts and graphs for deeper data exploration, allowing users to easily analyze trends, compare figures, and uncover insights.
Customization and Key Metrics: Users can tailor the dashboard to display relevant data, focusing on key financial performance indicators like cash flow, revenue, and expenses, which are crucial for informed decision-making.
Scalability and Security: Designed to grow with Salini, the dashboard is scalable for future expansion and incorporates strong security features to protect sensitive financial information.
Requirements Gathering and Design
(Month 1)
Collaborate with financial managers to identify key financial metrics and reporting needs.
Design the layout and functionalities of the dashboard.
Dashboard Development and Integration (Month 2)
Develop the dashboard, integrating various financial data sources.
Ensure the dashboard is user-friendly and customizable.
Testing and Refinement
(Month 3)
Test the dashboard for data accuracy and ease of use.
Gather feedback and make necessary adjustments.
Training and Deployment
(Month 4)
Train staff on how to utilize the dashboard effectively.
Deploy the dashboard for company-wide use.


